Content
An OEM purchasing manager once asked us why a prototype air cooler with a large airflow rating barely moved air across its wet curtain. The motor was not weak. The fan simply could not maintain enough static pressure to pull air through the evaporative pad. That mismatch shows up on the fan's PQ curve, and it explains why a spec sheet's maximum airflow figure can be dangerously misleading.
This article explains what a PQ curve is, how to read it, and why it should be part of every fan and evaporative air cooler sourcing decision.
A PQ curve, also written as P-Q curve, is a graph that shows the relationship between a fan's static pressure (P) and its airflow (Q). In fluid engineering, Q stands for volumetric flow rate. The horizontal axis shows airflow, usually in m3/h or CFM, and the vertical axis shows static pressure, usually in Pa or mmH2O. In fan engineering, the PQ curve is sometimes called the pressure-quantity curve or fan performance curve.
Every fan has a characteristic curve. If the outlet is fully blocked, the fan produces maximum static pressure but no airflow. If it blows into open space with no restriction, it produces maximum airflow but very little static pressure. Real air-moving systems operate between these two extremes.
For a forced-draft evaporative air cooler, the fan must pull air through the wet curtain, water distribution system, dust filter, and grilles. Each of these parts creates resistance, and that resistance increases as airflow increases. When the system resistance curve is drawn on the same graph as the fan curve, the intersection is the actual operating point of the product.
The first thing to understand is that a fan's maximum airflow is measured at zero static pressure. No practical evaporative air cooler has zero resistance. Therefore, the only meaningful airflow number is airflow at a specific static pressure.
In an evaporative cooler, the wet curtain is often the largest source of resistance. If the fan curve does not match that resistance, the fan operates lower on its curve than the brochure suggests. The result is lower air exchange, poorer water evaporation, and weaker cooling at the outlet.
Consider a fan with a free-air airflow of 2,000 m3/h. At 100 Pa, it may still deliver about 1,700 m3/h; at 250 Pa, it may fall to 1,100 m3/h. The numbers are illustrative, but the principle is real: the higher the system resistance, the more the airflow falls from the free-air rating.
| System Resistance | Typical Example | What Happens to Airflow | What to Prioritize |
|---|---|---|---|
| Low | Open blower, no duct, no filter | Closest to the free-air curve | High airflow capacity |
| Medium | Short duct, coarse filter | Moderate drop from free-air rating | A stable, reasonably flat curve |
| High | Wet curtain, fine filter, longer duct | Sharp drop in airflow | Static pressure at the target flow |
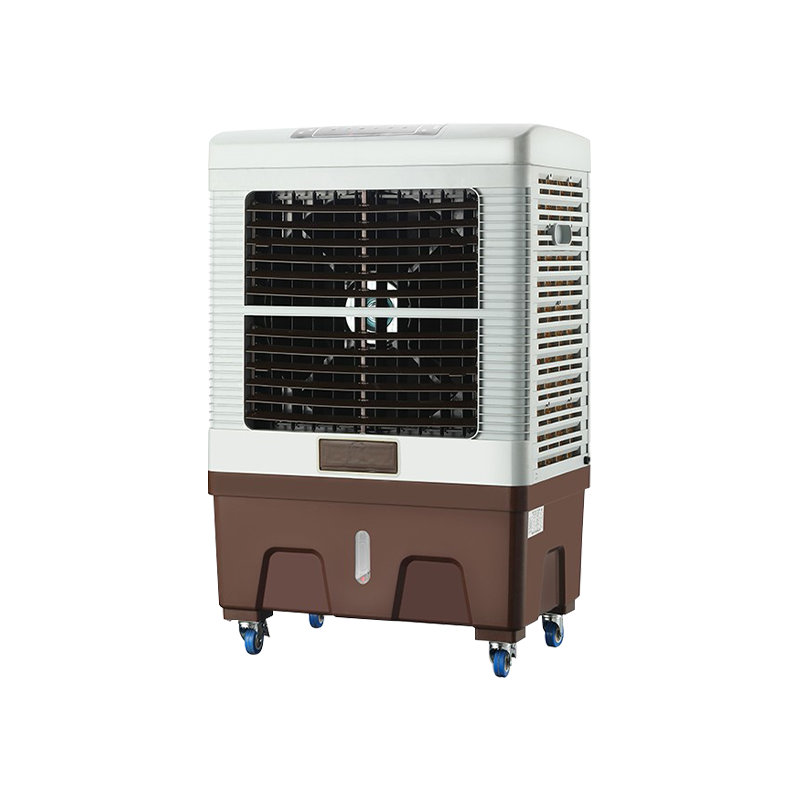
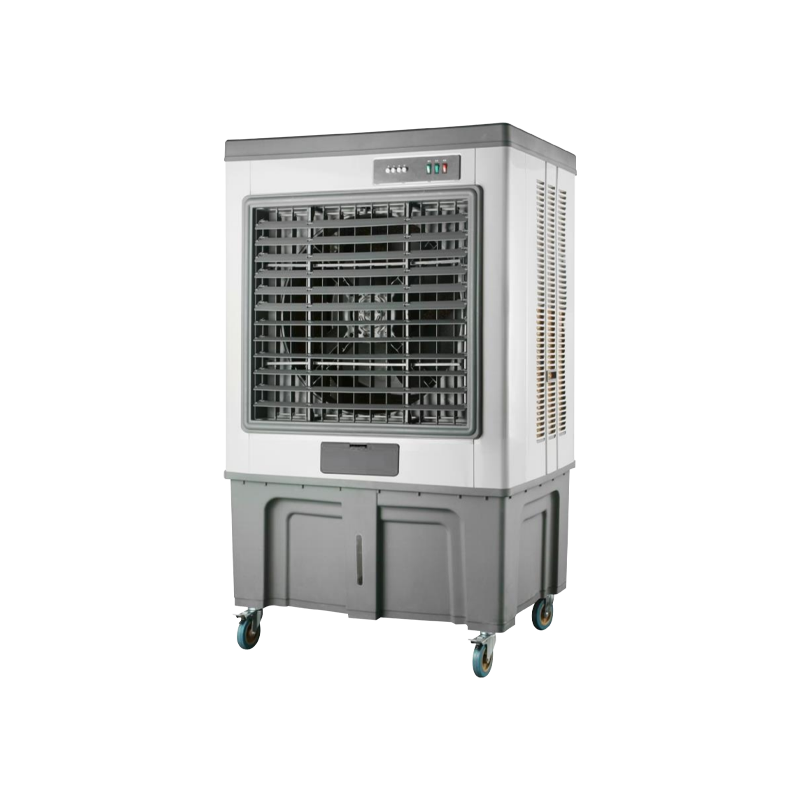
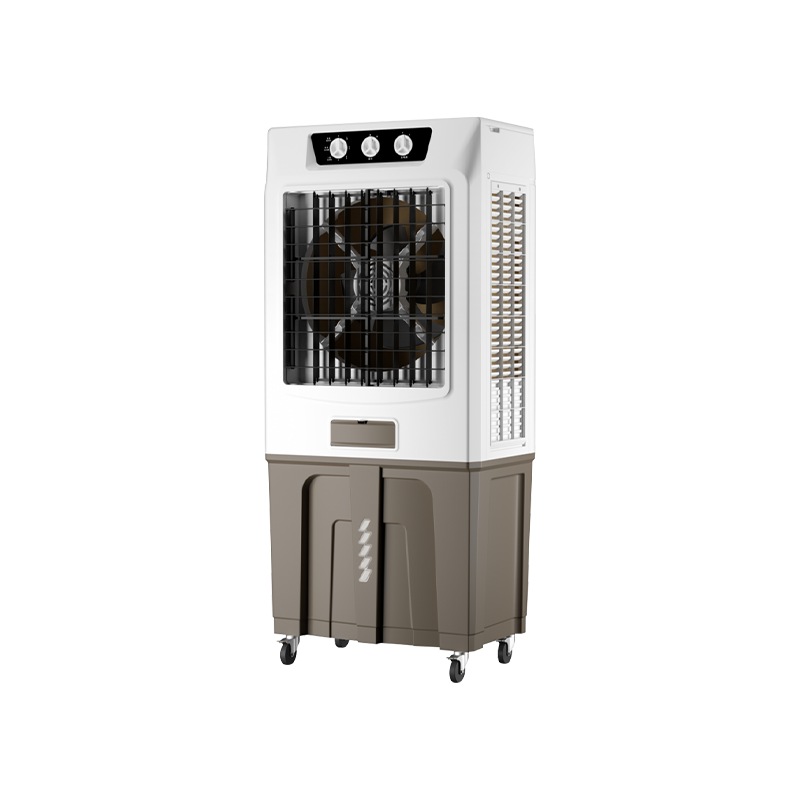
That is why we test the whole air path, not just the fan in isolation. Our LBW18000RC large-capacity evaporative air cooler is an example of a unit whose internal fan curve is chosen to keep useful airflow through a high-resistance wet-curtain assembly in industrial and large-area applications.
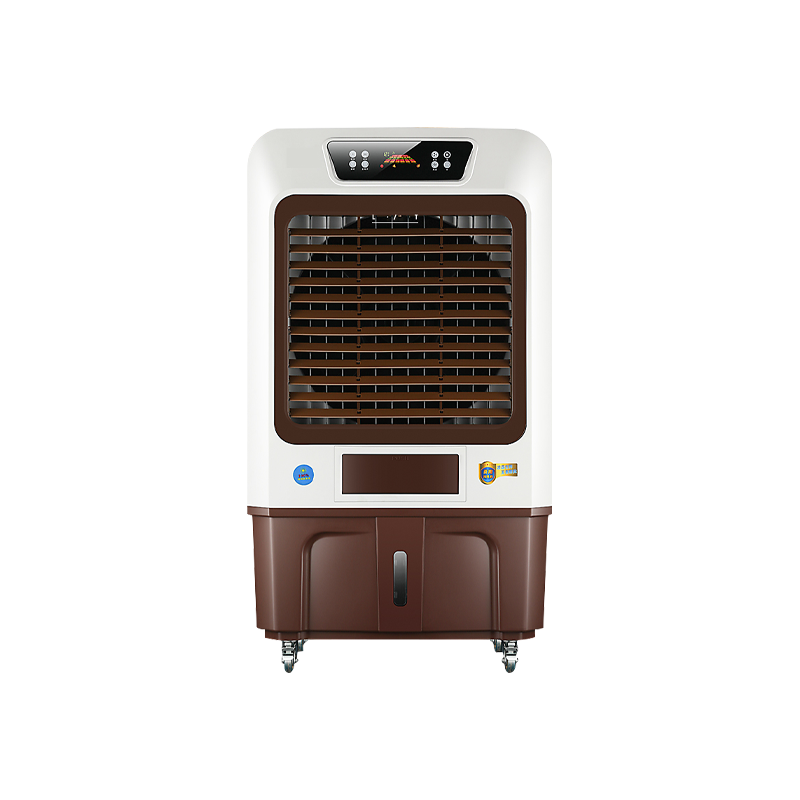 120L Large Capacity Floor-Standing Evaporative Air Cooler Suitable For Industry Bisheng Electrical Appliance Co., Ltd is a China OEM 120L Large Capacity Floor-Standing Evaporative Air Cooler Suitable For Industry And ...View Product →
Remember the core idea: a PQ curve shows how much air a fan can deliver at a given resistance. The operating point shows what the product will actually do in your system.
To find the operating point, plot both the fan curve and the system resistance curve. The system resistance increases with the square of airflow, which is why the system curve is a parabola. Where the two curves cross, the fan's pressure output equals the pressure needed to move air through the system. That is your real airflow.
Different fan designs produce different curve shapes. A simple axial fan often has a steeply dropping curve and may have an unstable stall region at low airflow. A centrifugal or blower-style fan tends to hold static pressure more steadily across its useful range. For evaporative air coolers, high-static axial and blower-style fans are common because of the resistance from wet pads.
A high maximum static pressure can be a false friend if that pressure is available only near zero airflow. Always compare airflow at the static pressure your system actually needs. If the supplier only gives you one operating point, ask for the full curve.
When a fan or air cooler supplier sends you a curve, do not just glance at the highest numbers. Ask these questions:
For OEM projects, the practical approach is to estimate your system resistance first. Select the wet-curtain material, calculate its pressure drop, and then choose a fan whose curve crosses the system curve near your target airflow. This avoids expensive changes after tooling is made.
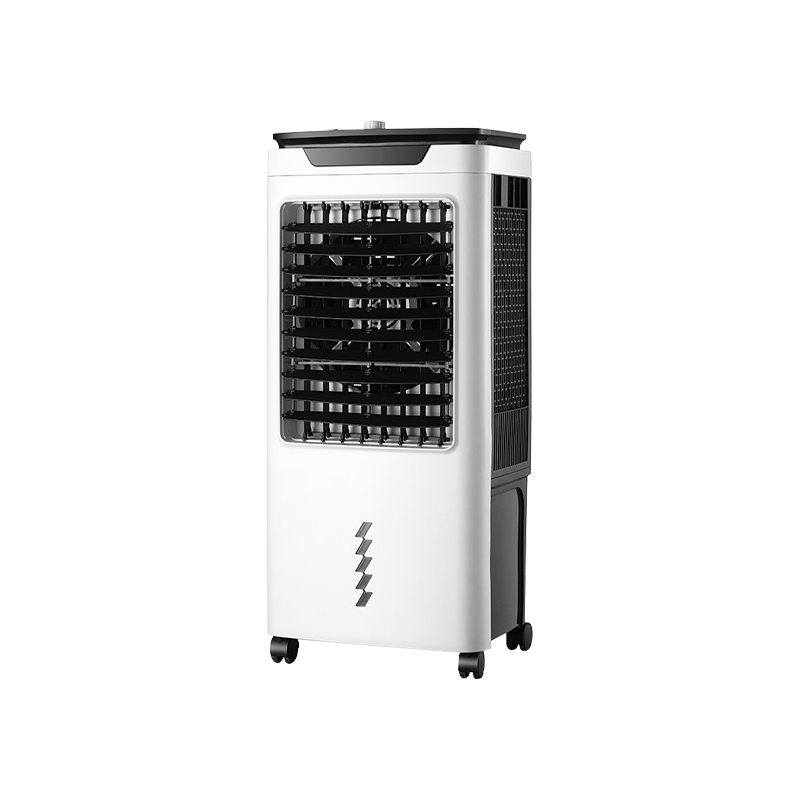
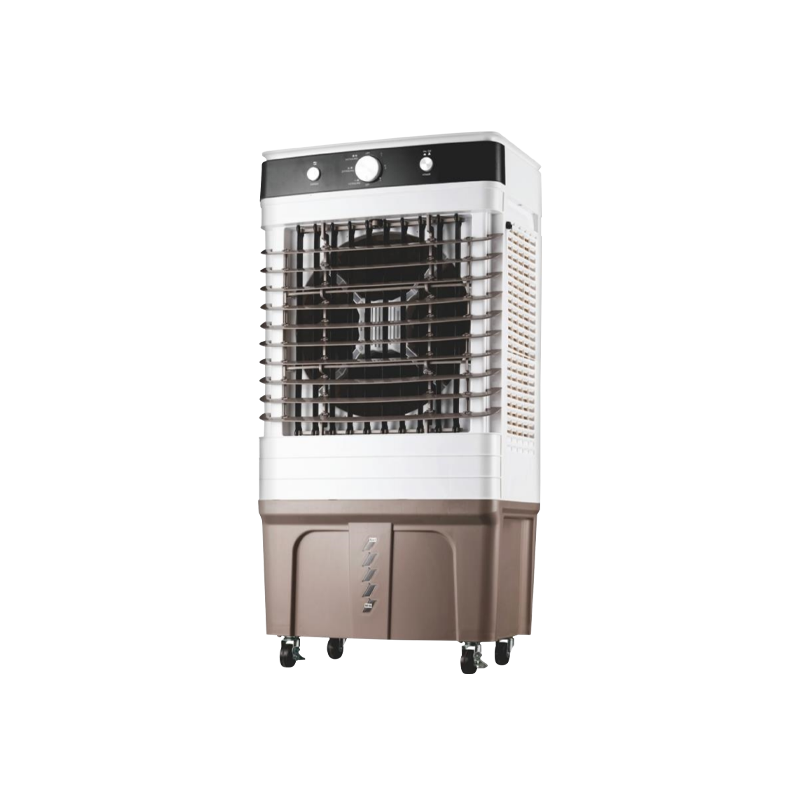
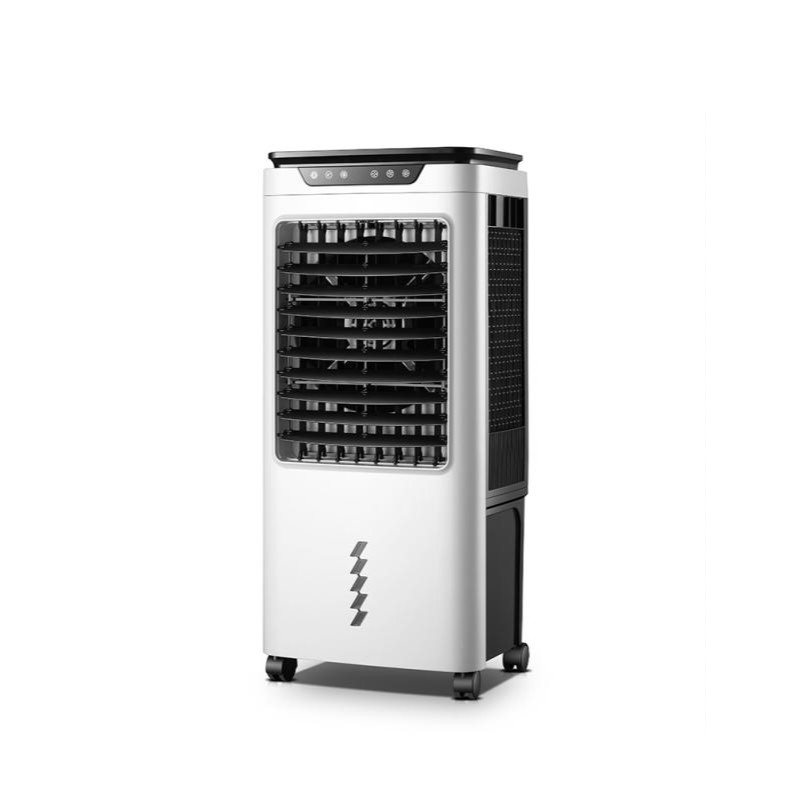
The same logic applies to compact portable units. A smaller cabinet and shorter air path change the resistance profile in a different way. Our 80 W 20 L portable air cooler is an example of a compact configuration where the fan curve is matched to a reduced cabinet resistance rather than to a large wet-curtain assembly.
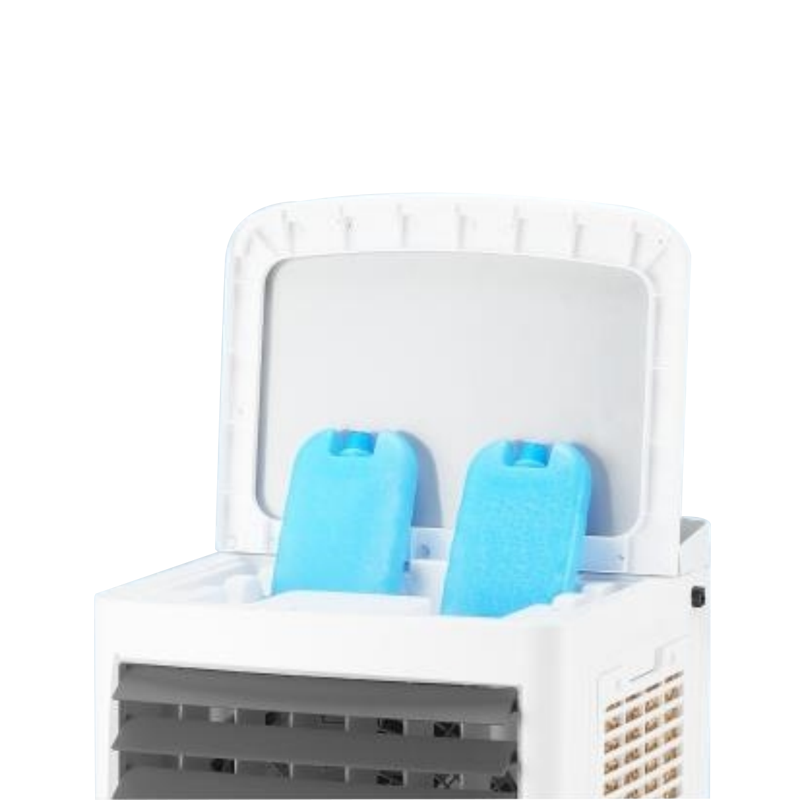 80W20L Portable Air Cooler LBW-5000RC-1 Suppliers, OEM Company - Bisheng ElectriBisheng Electrical Appliance Co., Ltd is a China OEM 80W20L Portable Air Cooler LBW-5000RC-1 suppliers and 80W20L Portable Air Cooler LBW...View Product →
After the curve is understood, the product still has to be verified. The wet curtain must be fully wetted, the water pump must supply the rated flow, and the fan must run at the rated speed. A change in any one of these shifts the operating point.
In ODM and OEM projects, successful development starts with a clear airflow target at a defined static pressure. That target should be part of the product specification, not replaced by a maximum CFM figure. When a customer brings a drawing, we use the PQ curve to confirm that fan, motor, and cabinet resistance are compatible. This saves time in prototyping and reduces surprises during certification and field testing.
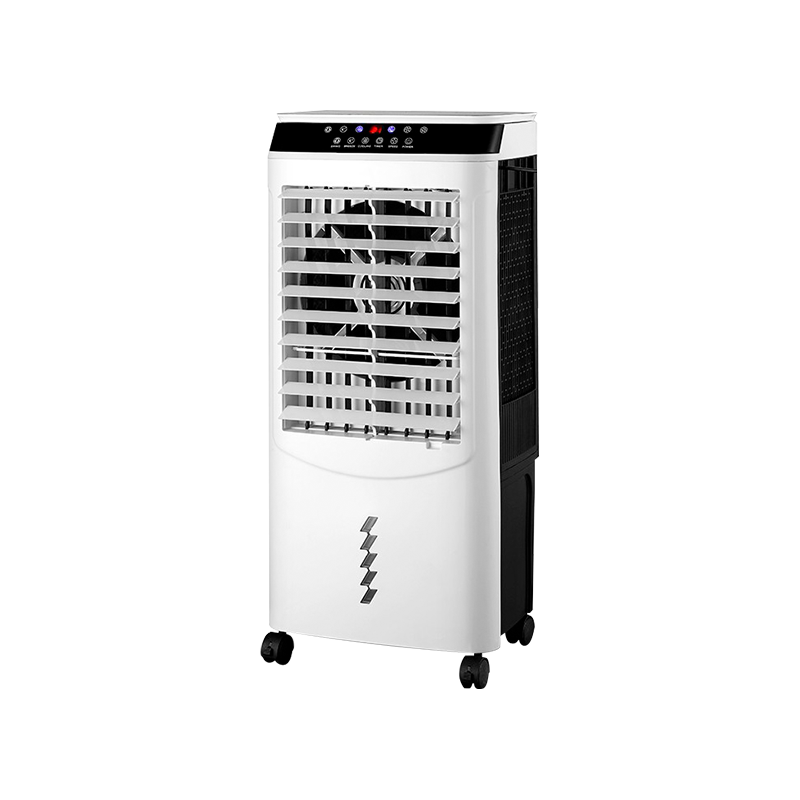
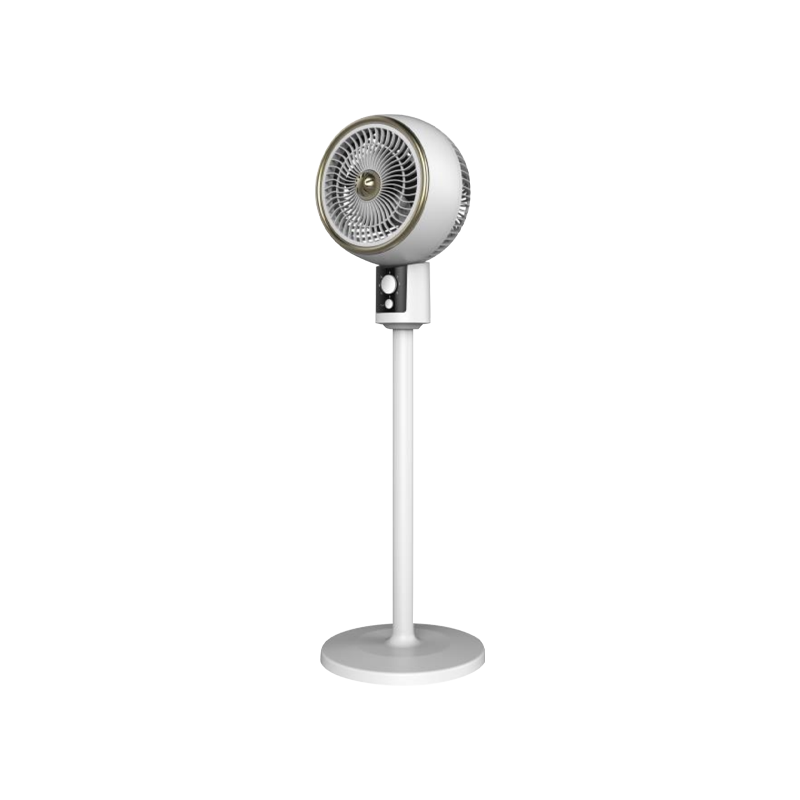
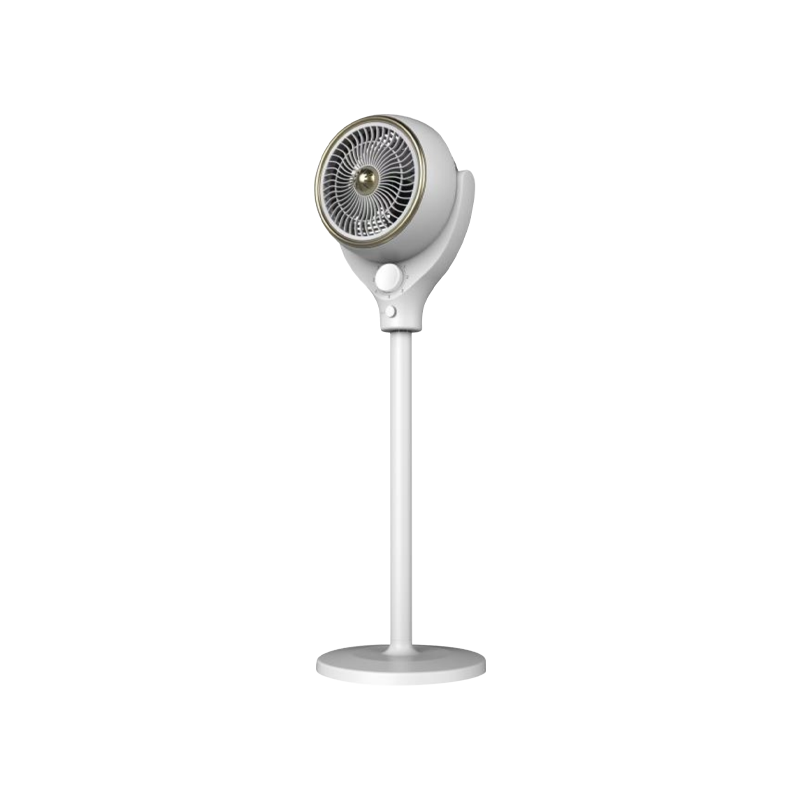
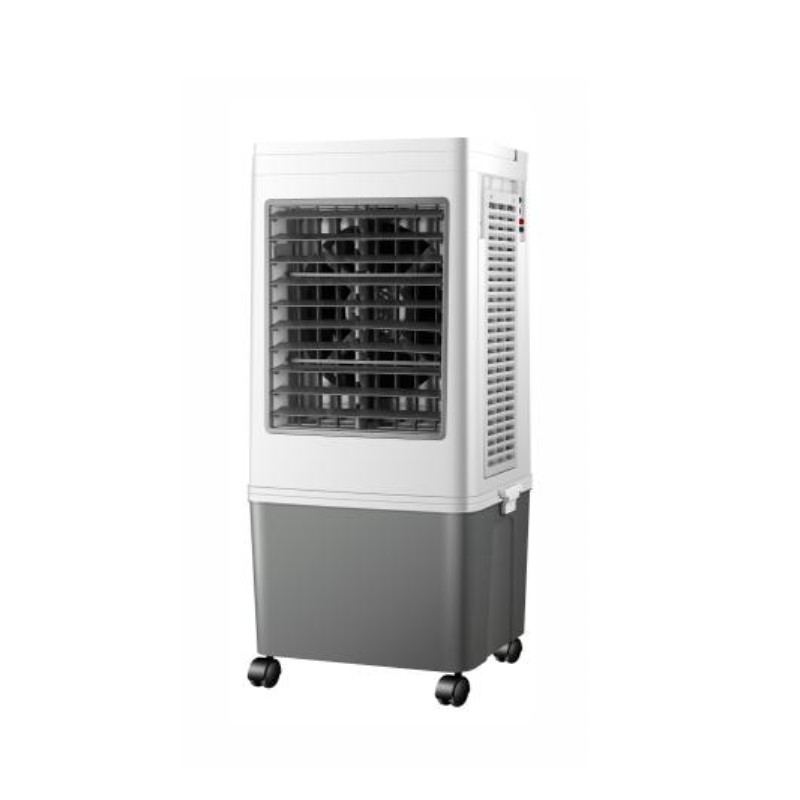
For medium-sized rooms, a unit with multiple operating modes and a moderate water tank works well when the fan curve stays reasonably flat across the speed range. The 120 W three-in-one touch screen air cooler is a concrete example of one fan design serving different airflow settings without a large loss of static pressure at low speed.
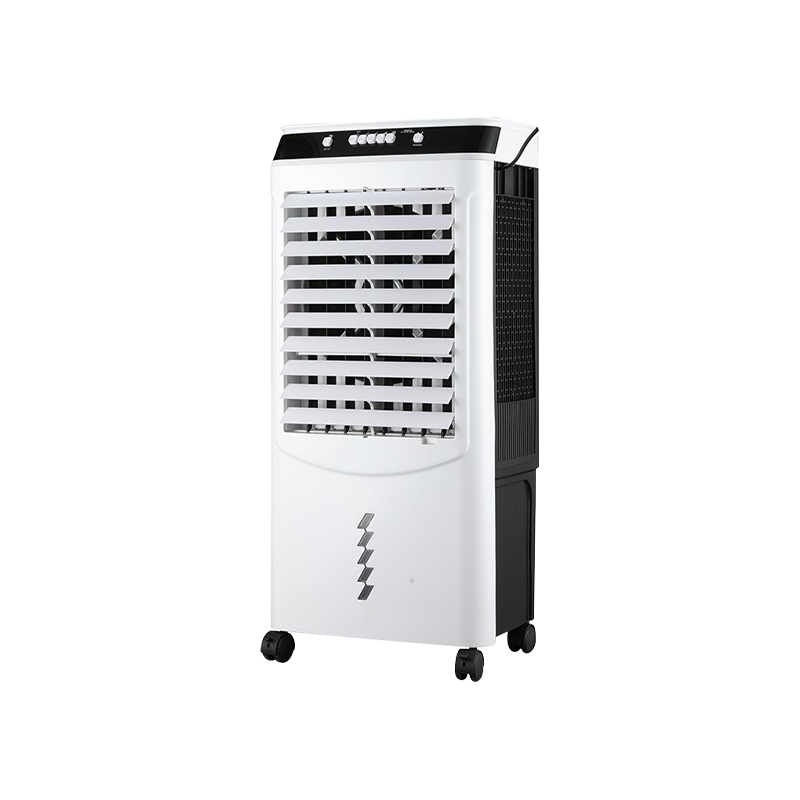 120w 3-In-1 Touch Screen Air Cooler LBW-6500/6500-1 Suppliers, OEM Company - BisBisheng Electrical Appliance Co., Ltd is a China OEM 120w 3-In-1 Touch Screen Air Cooler LBW-6500/6500-1 suppliers and 120w 3-In-1 Touch ...View Product →
If you want to compare product families and performance approaches, the cooling fan product range on our site is a good place to start. You can also read about the broader shift toward efficient air movement in our article on evaporative air coolers and the new trend of green cooling.
A PQ curve is not a theoretical graph for fan engineers alone. For anyone sourcing an evaporative air cooler or a replacement fan, the curve is the bridge between a component's maximum rating and its real-world performance. Start with the operating point, compare curves at that point, and use actual system resistance in your calculation. That is how you avoid the airflow shortfall that slows down product launches and disappoints end users.


No.1015 Guanfu Road, Fuhai Town, Cixi City,Zhejiang,China

+86 134-8601-6220



Copyright ? Cixi Bisheng Electrical Appliance Co., Ltd. All Rights Reserved.
Wholesale Portable Air Cooler Manufacturer




 English
 中文简体
中文简体 Español